
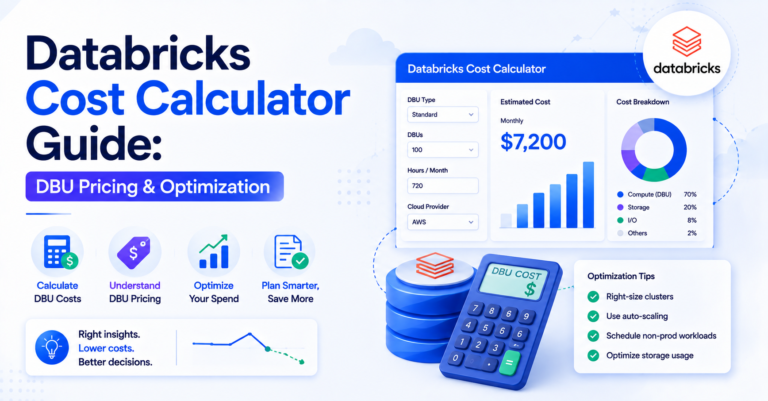
A Databricks cost calculator has to account for two separate charges at once: DBU pricing and the underlying cloud compute it runs on — not one or the other. Databricks has become the go-to unified platform for data engineering, data science, and AI workloads across AWS, Azure, and GCP, but as adoption scales, so does the complexity of predicting and controlling cost. Whether you’re running Databricks on AWS or Azure, understanding how DBU pricing works — and how to actually use a Databricks cost calculator to model it — is essential for any data team trying to avoid budget surprises.
Table of Contents
How Databricks Pricing Actually Works
Unlike a flat per-hour VM charge, Databricks pricing is built around the Databricks Unit (DBU) — a unit of processing capability billed per second of usage. Your total bill is a combination of three layers:
- Compute costs — the underlying cloud VM costs (AWS EC2, Azure VMs) that run your clusters.
- DBU consumption — the Databricks platform fee layered on top of compute, which varies by workload type (Jobs, All-Purpose Compute, SQL Warehouses, Delta Live Tables, Model Serving).
- Storage and networking — cloud-native charges for storage (S3, ADLS) and data transfer.
This is why DBU pricing alone isn’t enough to estimate spend — any real Databricks cost calculator has to combine DBU rates with your cloud provider’s compute rates to get a true picture of total cost.
Understanding DBU Pricing by Workload Type
Each compute type has a different DBU rate:
| Workload type | DBU pricing tier | Typical use case |
|---|---|---|
| Jobs Compute | Cheapest tier | Automated, non-interactive pipelines |
| All-Purpose Compute | Priced higher | Interactive notebooks and ad-hoc analysis |
| SQL Warehouses | Serverless and pro tiers | BI and SQL workloads |
| Delta Live Tables | Priced per DBU | Managed ETL pipelines |
| Model Serving / ML workloads | GPU-backed, own DBU rate | Machine learning inference |
The effective hourly cost depends on workload type, cluster size (node count and instance type), cloud provider, and region — and should always account for how long clusters stay idle versus active, since auto-termination settings can dramatically change effective spend.
Databricks Cost Optimization Strategies
Once you understand pricing mechanics, the real value comes from Databricks cost optimization. Here are the highest-impact levers:
- Right-size your clusters. Oversized clusters are the single biggest source of wasted DBU spend. Use cluster utilization metrics to match compute to actual workload demand instead of defaulting to large instance types “just in case.”
- Use Job Clusters instead of All-Purpose Clusters for production pipelines. Job clusters spin up, run, and terminate automatically — eliminating idle time charges that accumulate on always-on interactive clusters.
- Enable auto-termination aggressively. Idle interactive clusters are a silent cost leak. Set auto-termination to the shortest reasonable window (10–20 minutes of inactivity).
- Leverage spot or preemptible instances. Both AWS and Azure Databricks support spot instances for non-critical workloads, cutting compute costs significantly while DBU rates stay the same.
- Use SQL Serverless Warehouses for BI workloads. Serverless removes the need to manage cluster start-up time and idle capacity, often reducing total cost for spiky BI query patterns.
- Adopt Photon and query optimization. Photon-accelerated compute can reduce runtime significantly, which directly reduces DBU-hours consumed even though the per-DBU rate is slightly higher.
- Tag everything for chargeback visibility. Proper tagging of clusters, jobs, and workspaces by team or project is the foundation of any serious Databricks cost management practice — you can’t optimize what you can’t attribute. See cloud tag management for the underlying discipline this depends on.
Databricks Cost Monitoring and Management
Databricks cost monitoring shouldn’t be a monthly surprise exercise. Build a continuous practice around:
- System Tables (Unity Catalog) — Databricks now exposes billing and usage data as queryable system tables, letting you build custom dashboards on DBU consumption by workspace, cluster, job, and user.
- Budgets and alerts — Set budget policies at the account level to get proactive alerts before overspend happens; see cloud budget alerts for how to set thresholds that actually catch a trend early.
- Cluster policies — Enforce guardrails (max node count, allowed instance types, auto-termination) so teams can’t accidentally provision runaway compute.
- Cost dashboards — Whether native or through a third-party FinOps tool, a live dashboard of DBU cost trends by workload type is non-negotiable for teams running Databricks at scale.
Azure Databricks Pricing Nuances
For teams specifically evaluating Azure Databricks, note that Azure offers it as a first-party service (unlike the marketplace-based AWS listing), which means:
- Azure Databricks costs can be applied toward Microsoft Azure Consumption Commitment (MACC) agreements.
- Reserved VM instances on Azure can be combined with standard DBU rates for further compute savings.
- Azure Hybrid Benefit may apply to underlying VM costs in certain configurations.
This makes Databricks cost optimization on Azure slightly different in practice from AWS — savings plans and commitments matter more heavily in the Azure ecosystem. For the broader provider pricing comparison this fits inside, see AWS vs Azure vs GCP cost.
Building Your Own Databricks Cost Calculator Workflow
If the native pricing calculators feel too generic for your workload mix, consider building an internal Databricks cost calculator spreadsheet or dashboard that models:
- Historical DBU-hour consumption by workload type, pulled from system tables.
- Projected growth in job frequency and data volume.
- Blended DBU plus compute rate per workload category.
- Scenario modeling for right-sizing and reserved capacity decisions.
This gives finance and engineering teams a shared source of truth instead of relying solely on after-the-fact cloud bills. For the tactical cost-cutting sequence this feeds into, see the cloud cost optimization checklist.
Frequently Asked Questions
What is a Databricks cost calculator used for?
Estimating total Databricks spend by combining DBU pricing (the platform fee, billed per second by workload type) with the underlying cloud compute cost — since neither figure alone reflects true spend.
How does DBU pricing differ by workload type?
Jobs Compute is the cheapest tier for automated pipelines, All-Purpose Compute is priced higher for interactive notebooks, SQL Warehouses have serverless and pro tiers, and Model Serving uses GPU-backed compute with its own DBU rate.
What’s the difference between the Azure and AWS Databricks pricing calculators?
The Azure Databricks pricing calculator is integrated into the Azure Pricing Calculator and combines VM and DBU costs in one view; the AWS version requires estimating EC2 instance costs and DBU consumption separately, then combining them manually.
What’s the single biggest lever for Databricks cost optimization?
Right-sizing clusters. Oversized clusters are the single biggest source of wasted DBU spend, and matching compute to actual workload demand — rather than defaulting to large instance types “just in case” — has the highest impact of any single change.
How should Databricks cost monitoring be structured on an ongoing basis?
Around continuous system-table-based dashboards, account-level budget alerts, cluster policies that prevent runaway provisioning, and a live cost dashboard by workload type — not a monthly reconciliation exercise after the bill arrives.