
Cloud Cost Analysis:Uncover Root Cause From Spike in 4 Minutes
The finance team sends an email at 9 AM. AWS spend is up 34% month-over-month. They want an explanation by end of day.
You open your billing dashboard. Total spend: $847,000. Last month: $632,000.
The number is real. The cause is invisible.
You export to a spreadsheet. Filter by service. EC2 is up — but EC2 covers hundreds of instances across a dozen accounts in four regions. You pivot on account. Three accounts show significant increases. You open another tab, pull cost explorer for the first account, filter by region, filter by instance type. Twenty minutes in, you have a partial answer and three new questions.
This is how cloud billing analysis works for most teams today: manually, slowly, and across too many tabs.
Cloud cost analysis drill-down is built for a different workflow — one where the answer to “why did this go up” takes minutes, not a morning.
Why Cloud Billing Analysis Takes So Long
Cloud bills are not flat. They are nested.
A total spend number is the sum of providers, which are the sum of accounts, which are the sum of services, which are the sum of regions, which are the sum of resource types, which are the sum of individual resources.
The spike is always somewhere in that stack. The question is where.
Most Tools Handle the Extremes, Not the Traversal
Summary dashboards deliver cloud cost visibility at the top of the stack well: total spend, month-over-month trends, top services by cost. Raw cost explorer tools show you the bottom well: per-resource line items, granular query builders.
What almost none of them handle is the middle — getting from “spend is up” to “here is the specific thing that changed” without losing context at every step.
You start at the summary. You click into EC2. The summary disappears. You are now looking at EC2 in isolation, with no reminder of what percentage of total spend it represents. You filter by account. The EC2 context disappears. You filter by region. By the time you reach the resource level, you are looking at a number with no frame of reference for how it connects to the original anomaly.
That loss of context is not a minor inconvenience. It is what turns a four-minute cloud spend analysis into a two-hour one.
What Contextual Cloud Cost Analysis Drill-Down Actually Means
The capability that changes this does one thing: it keeps you in context at every layer of the investigation.
You start at total spend. You click a service that looks anomalous. The view narrows — but you can still see where you came from. You click an account within that service. The view narrows again. You click a region. Then a resource type. Then a specific resource.
Each click is a refinement, not a replacement.
The breadcrumb above the view tracks exactly where you are in the stack:
Total → EC2 → prod-account-us → us-east-1 → m5.2xlarge → i-0a1b2c3d4e5f
You can step back at any point without losing the path you took. At each layer, the cost context travels with you: the absolute number, the change from last month, the percentage of parent spend. You are not hunting for a number — you are watching the number narrow toward a cause.
Real Cloud Cost Analysis, Layer by Layer
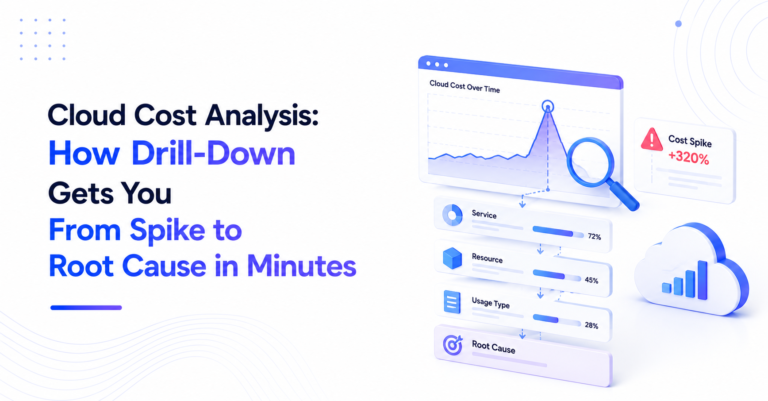
Here is how that 34% increase investigation unfolds with FinOps billing drill-down:
| Layer | View | Finding |
| 1 — Total spend | $847K this month vs. $632K last month | Spike began on the 12th |
| 2 — By service | EC2 +$148K, RDS +$52K, S3 flat, Data Transfer +$15K | EC2 is the primary story |
| 3 — EC2 by account | Three accounts show increases | prod-payments up $89K — over half the EC2 delta |
| 4 — prod-payments by region | us-east-1 up $84K, other regions flat | Spike is geographically concentrated |
| 5 — us-east-1 by resource type | m5.4xlarge up $79K, everything else flat | Instance type isolated |
| 6 — m5.4xlarge instances | Seven new instances launched on the 12th, tagged payments-load-test | Root cause: undecommissioned load test |
Total time: under four minutes.
The answer: a load test environment was provisioned on the 12th and never decommissioned. $79K and counting.
Without drill-down, that same investigation takes 45 minutes to two hours depending on the analyst’s familiarity with cost explorer tooling — and that assumes they knew which account to start with.
Why the Time Difference Compounds
The speed gap is not just a comfort issue.
A spike caught on the 12th is a one-week problem. The same spike caught on the 30th, when the bill arrives, is a full-month problem.
The $79K becomes $237K before anyone knows why.
Why Context Preservation Is a Cost Anomaly Detection Capability, Not Just UX
This sounds like a user interface detail. It is actually a reasoning tool.
When context disappears at each transition, you cannot see when an anomaly at one layer does not explain the anomaly at the layer above.
EC2 is up $148K. You click in. EC2 is up — but proportionally, it is flat as a percentage of total spend. That means EC2 is not the real story. You need to step back and look at a different branch.
That realization requires two things: the data at the current layer, and the comparative context from the layer above.
Most tools give you the first. Drill-down gives you both.
At every step, the view shows where you are in the billing hierarchy, this layer’s spend as a percentage of the parent, how the trend here compares to the trend one level up, and how to navigate back to any prior layer without losing your filters.
That last point enables something the existing approach does not: hypothesis testing.
You think the spike is in EC2. You click in. It is not — the numbers do not explain the parent anomaly. You step back. You try Data Transfer. There it is: CDN egress doubled because a misconfigured cache policy expired.
You would not have found that in a report. Reports show what the analyst anticipated you would want to know. Cloud cost analysis drill-down lets you follow the thread wherever it actually leads.
When Multi-Cloud Cost Management Drill-Down Matters Most
Budget Alert at 11 PM
When an alert fires outside business hours, you do not have time to build a cost explorer query from scratch.
You need to get from “the alert fired” to “here is what caused it” in the fewest possible steps.
Starting from the alert’s cost center and descending directly to the responsible resources with full context intact is the only workflow that works under that pressure.
The Routine Review That Becomes an Incident
Drill-down is useful for scheduled cost reviews. It is indispensable when a routine review surfaces something that requires immediate escalation.
The moment you need to explain the number to an engineering lead or a finance partner, you need the answer — not a work-in-progress spreadsheet and a promise to follow up.
Who Can Now Do the Cloud Spend Analysis
Today, detailed multi-cloud billing analysis requires someone with specific expertise: knowledge of the cloud account structure, fluency with cost explorer query models, and understanding of which services map to which business units.
That is a specialized skill. It concentrates cost accountability in the hands of the FinOps specialists — the people who know how to dig.
Contextual drill-down changes the skill requirement from technical to navigational. You start at the number that matters and click toward the cause. The path is visible. The context is preserved.
An engineer who has never written a cost explorer query can follow an investigation from total spend to root cause because the trail is there in front of them.
The organizational consequence: cost accountability can move to the team that owns the spend, not just the team that knows how to investigate it. Engineering leads can answer finance questions about their own accounts. Product teams can track the cost impact of their own deployments. The FinOps specialist becomes a policy setter and escalation point, not the only person who can read the bill.
Frequently Asked Questions
How is this different from AWS Cost Explorer’s drill-down features?
AWS Cost Explorer is a single-provider tool. It does not aggregate spend across Azure or GCP, does not preserve cross-layer context in the same view, and does not maintain breadcrumb navigation across filter steps. CloudPi’s drill-down works across all three major providers in a single investigation flow, with context and hierarchy preserved at every layer.
Does drill-down work across multiple cloud providers in a single investigation?
Yes. If your total spend includes AWS, Azure, and GCP, the Layer 2 service breakdown spans all three providers. You can descend into an Azure account’s spend from the same investigation that started at the total multi-cloud number. The breadcrumb tracks the full cross-cloud path.
Can non-technical users run a drill-down investigation?
The workflow is navigational, not query-based. You click a number to go deeper; you click a breadcrumb to go back. There is no query language to learn and no export step required. A finance business partner or an engineering manager can run the investigation themselves without FinOps support.
How far down can you drill — to the individual resource level?
Yes, to the individual resource ID. The full path goes: Total → Provider → Account → Service → Region → Resource Type → Resource. At the resource level, you see the specific instance, bucket, or database responsible for the cost, along with its tags, launch date, and month-to-date spend.
Does the drill-down path save or export for sharing with finance?
The breadcrumb state is shareable — you can send a link to a specific drill-down position and the recipient lands at the same layer with the same filters applied. For formal reporting, the view exports to the CloudPi report format, which finance teams can receive via scheduled delivery or on-demand share.
Using It
The drill-down capability is live in Billing Analysis in CloudPi.
Open the Billing Analysis view, select your date range, and click any number in the summary to begin descending. The breadcrumb trail at the top of the view tracks your path. Each layer is clickable forward to go deeper, backward to step out without losing the filters you set.
The next time finance sends that 9 AM email, you will have the answer before you finish your first coffee.
CloudPi is a multi-cloud FinOps platform for teams that need cost visibility, governance, and automated optimization across AWS, Azure, and GCP. Billing Analysis is one part of a broader system that includes Intelligent Workflows automation, TRUE Savings attribution, and automated cost assignment.